If you’re a social media marketer then Engagement Rate is likely to be high on your list of key metrics – if not the number one. However, believe it or not there isn’t a standard calculation for Engagement Rate. There are in fact numerous iterations that provide significantly different end results – a highly dangerous thing for the decision making marketer.
What then are these different calculations and when should we be using them?
- Engagement Rate According to Facebook:

What is it?
Let’s start with the ‘official’ engagement rate; Facebook looks at Engagement Rate from a pure post perspective. It’s the total number of engagements with a single post divided by the number of people who saw that post.
The fact that Facebook only deals in Engagement Rate from a post perspective is a very important distinction. As you will see later on in this blog , some Engagement Rates are calculated at Page level and (generally) produce much lower figures, so understanding that Facebook Insights is reporting a post level metric is incredibly important.
When to use it?
In my opinion, this is the most important Engagement Rate for social marketers to be tracking regularly along with Twitter’s. In essence, it is a clear indicator of how interesting your content is and therefore a highly valuable tool in driving your page forward and turning your audience into a group a loyal brand advocates. If your post is boring, excellent, or just a bit ‘meh’ this is the metric that will give you the answer.
Significantly, it takes into account Clicks as well as Likes, shares and comments. Why is that important? Because, clicks are our invisible and often forgotten friend. In my experience, too many marketers assess the success of their posts at face value – i.e. look at the number of Likes, shares and comments and don’t delve deeper to look at clicks too. This is doing their content a serious disservice.
I don’t know about you, but I am one who sits firmly in the ‘clickers’ category when it comes to social media. I will read a high percentage of the articles I see in my News Feeds and Timelines, but I very rarely perform any of those visible actions. And a lot of your audience is likely to be the same too. What could, at first glance, look to be a pretty poor performing post (#alliteration) may in fact have been one of your best ever, and you might not even have know it. Don’t judge a book by it’s cove or a post by it’s Likes…
- Engagement Rate According to Twitter

What is it?
Again, this is an Engagement Rate calculation that looks exclusively from a post perspective. However, there are also important differences that you will need to bear in mind. Firstly, Twitter look at the number of engagements and not the number of engaged users, and secondly it deals in Impressions.
What this means is that Twitter’s Engagement Rate does not look at the unique number of people who saw the post (Reach), but instead makes it’s calculation based on the total number of times the post was seen (Impressions). As a result, you can typically expect to see much lower figures for Twitter Engagement Rates. This is also due to the fact that Twitter operates using an unfiltered Timeline. As an example:
A Retweet will be seen by everyone who follows the Retweeter regardless of whether they are interested in the original Tweet or not. However, with Facebook’s complex algorithms, if a person shares a post it won’t necessarily be seen by every friend of the sharer – it will only be shown to those Facebook believes will actually be interested in the original post. As a result, you will naturally always see higher engagement rates on Facebook.
When to use it?
Like with Facebook this is a metric you should monitor constantly to figure out what content works and engages your audience and what switches them off. If content really is King then this is the one metric you should be obsessing over.
All pretty straight forward so far? Well, this is where things start to get a bit confusing and where the clarity is needed.
- Audience Post Engagement Rate

What is it?
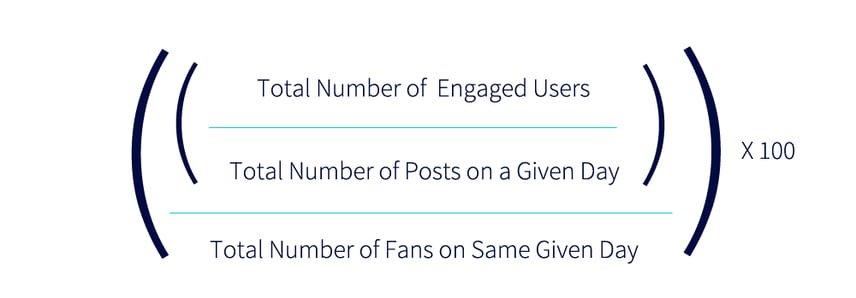
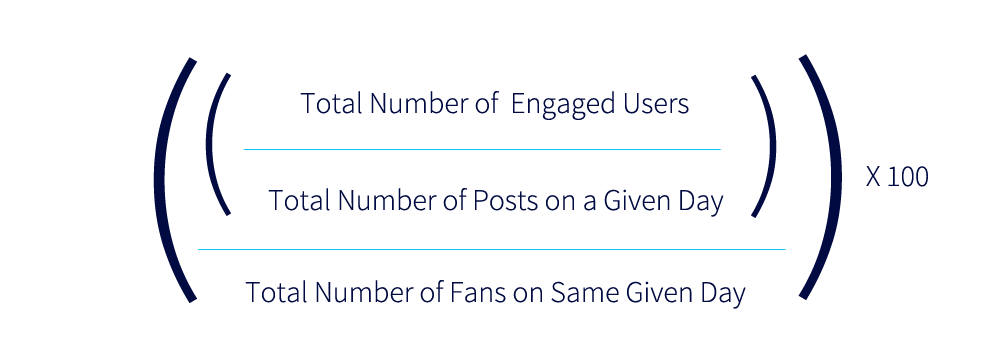
One that was pioneered by Social Bakers, this type of Engagement Rate will give you a snapshot of the percentage of your overall audience that you are Engaging on a daily basis per post. For a truly valuable metric, you should try to use this equation each day for a defined time period and calculate the average rather than use for one off purposes.
When to use it?
The value in this, particularly from a Facebook perspective with its News Feed algorithms, is in seeing whether you’re missing out on a significant proportion of your audience so that you can then assess the need for a re-engagement strategy. With Facebook’s diminishing organic Reach it’s inevitable that a large proportion of your audience is not seeing any of your content at all. This doesn’t necessarily mean they aren’t interested in your brand anymore; they just need a reminder you’re still around – most likely through promoted content.
- Page Engagement Rate

What is it?
This will give you the percentage of your overall audience you are engaging within a given period of time.
When to use it?
Similar to the Audience Post Engagement Rate this can be a good reference point when looking at the progression or overall success of your page compared to other points in your pages history. Having said that it is important to remember that Facebook’s organic reach dropped significantly for most brands in August 2013 so any comparisons between now and prior to that date should really be ignored.
A Bit On Benchmarking…
Once you’ve got to grips with all the above and started to have a look at your own page’s figures the inevitable next question is “well, what’s a good engagement rate?”.
This is where things go from confusing to complicated. Benchmarks for engagement rates are extremely difficult to come by, as the data is private to each individual brand. At one point Social Bakers had possibly the only benchmarking report for organic engagement rates – however this was only for page level engagement rates not post level and furthermore, is now a good year or so out of date. Significantly, with organic reach dropping and brands investing more and more in advertising on Facebook comparisons to other brands have become increasingly inaccurate. The reason for this is because the necessary equation relies on Engaged Users divided by Total Fans and if you are investing in advertising then you most likely are opening up your content to non-fans, thus skewing the results. In fact, Social Bakers have recently come out to state that using their original method of calculating engagement rate is no longer valid and instead you should be focusing on the sheer volume of interactions instead.
However, this is also problematic as if you want to benchmark against your competitors you only have the face value interactions to base your results on not our invisible friend – clicks. Therefore, whatever you come up with at the end has to be taken with a pinch of salt as it isn’t a true or accurate reflection of engagement. Furthermore, there’s no way to tell what has been boosted with an advertising budget by your competitors and what has not – your stats are moving ever further from ‘usefulness’.
Ultimately, the answer for marketers is a frustrating one. The only way to truly benchmark the progress of your page, in terms of engagement rate, is against itself. Only then will you be able to compare accurate results and define whether you’ve had a successful period, whether you need to adjust your strategy or go back to the drawing board.
Stay Updated with Our Latest Insights
Get expert HubSpot tips and integration strategies delivered to your inbox.


